


Quick Summary
Your social media engagement rate is dropping for five reasons: people share privately instead of liking, inactive followers dilute the percentage, hooks lose viewers fast, low-effort posting waters down quality, and early interaction stalls. Part of the decline is industry-wide.
Benchmark first. Rival IQ’s 2026 Social Media Industry Benchmark Report puts Instagram’s all-industry median engagement rate at 0.30%, down from 0.36%, a fall of roughly 17%. TikTok’s median softened to 2.01%, while X rebounded from 0.015% to 0.03%. These figures cover brand accounts and divide interactions by followers, so a small slide may be platform-wide. A steeper or longer drop points to your own account. Match your symptom below to its likely cause.
| Symptom in your analytics | Likely root cause | Where to confirm |
|---|---|---|
| Likes fall but sends and saves hold or rise | Silent consumption (Cause 1) | Sends and saves versus likes, per post |
| Followers grow; reach and interactions stay flat | Ghost followers (Cause 2) | Reach split: followers versus non-followers |
| Reels lose most viewers in the opening seconds | Hook fatigue (Cause 3) | Retention graph and average watch time |
| More posts, fewer interactions per post | Low-effort over-posting (Cause 4) | Engagement by reach, grouped by content pillar |
| Little interaction soon after posting | Stalled early velocity (Cause 5) | Early interactions versus your usual baseline |
Cause 1: The Rise of “Silent Consumers” and Private Sharing
People increasingly react in private: they watch, then send a post to a friend instead of double-tapping, so public likes and comments fall even when content resonates. The interaction still happens, but in direct messages that visible counts never show.
Instagram’s head, Adam Mosseri, has said that far more photos and videos are shared into DMs than into Stories, and more into Stories than into the feed, in an interview with Business Insider. Ranking signals point the same way: Mosseri named watch time, likes and sends as the top three signals, with likes slightly more important for existing followers and sends slightly more important for reaching new people.
How to check: open Insights for your last 15 posts and compare likes with sends and saves. If sends per reach is steady or rising while likes per reach slips, your audience is lurking and forwarding rather than leaving. That is a behaviour shift, not a quality problem. Fix: build posts worth sending: one specific, relatable idea that makes someone think of a particular friend, closed with a send prompt instead of a generic “like if you agree”. For tactics, see our guide to getting more social media shares.
Cause 2: High Inactive or Ghost Follower Ratios Diluting Your Score
Ghost followers drag engagement down because they count in your follower total but never see, like or comment on your posts. Your rate by followers falls as the audience grows without activity, even if real fans engage exactly as often as before.
Instagram doesn’t list inactive followers, so use a proxy: follower reach rate, meaning the reach a post achieves among followers divided by your follower count. Insights splits reach between followers and non-followers. If your follower count climbs while that rate keeps falling, a growing slice of your base is dormant, spammy or bought. Also scan recent followers for tell-tale patterns: no profile photo, no posts, random usernames, or thousands of accounts followed.
Fix: remove obvious spam accounts from your follower list, but keep expectations realistic. Removing 1,000 dormant accounts from a 20,000 base lifts 100 interactions per post from 0.50% to about 0.53%. The percentage tidies up; your reach doesn’t change. Real recovery comes from content that earns attention from the followers who remain.
Cause 3: Hook Fatigue and First-3-Second Drop-Off
Hook fatigue sets in when your openings look and sound like every previous post, so viewers swipe away before watch time can build. Because watch time ranks among Instagram’s top three signals, early drop-off limits distribution and, with it, the interactions you receive.
Open the retention graph for your last ten Reels or TikToks, where your platform provides one. A steep cliff in the first few seconds means the opening failed, however good the rest is. Then sort recent posts by opening pattern: the same greeting, the same text overlay, the same first shot. Repetition is the usual sign of fatigue, and it tends to appear as a slow decline across several posts rather than one bad video.
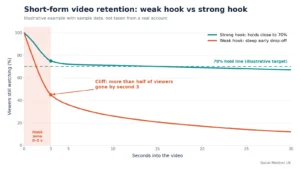
Fix: lead with the payoff or the tension, put the key line on screen in the first frame, and cut greetings and throat-clearing. Rotate three or four opening structures, such as a bold claim, a before-and-after, a question and a surprising result, and change only the opening across your next three posts so you can see which lifts retention. The goal is an early retention line that flattens rather than falls off a cliff; the exact percentage achievable depends on your niche and video length.
Cause 4: Over-Posting Low-Effort Content vs High-Value Pillars
Posting more often lowers your engagement rate when each extra post is weaker than the last. Interactions per post fall, repetition builds, and watch time and sends are spread across more, thinner posts instead of concentrating on your best ideas.
Rival IQ’s 2026 data shows brands already adjusting. Median Instagram posting slid to 3.7 posts per week, the lowest in the report’s six-year view, while TikTok brands posted about twice a week yet earned far higher engagement. That comparison doesn’t prove fewer posts cause higher engagement, but it undercuts the idea that volume protects your rate. Instagram publishes no frequency penalty; the cost is dilution.
Check and fix: group your last 30 days of posts into three or four content pillars, such as teaching, proof, story and community, and compare engagement by reach for each. Cut or rework the weakest third. Then set a publishing standard: every post needs one clear idea, a tested hook and a reason someone would send it to a friend. If a post fails that test, hold it back. Fewer, stronger posts protect both your rate and your audience’s attention.
Cause 5: Stalled First-Hour Velocity and How to Fix It
When a post attracts few interactions soon after it goes live, ranking systems have little early evidence that it deserves a wider audience, so it stalls and your rate sinks. Rebuilding a healthy early baseline of likes and comments gets distribution moving again. Instagram doesn’t publish a first-hour rule, but it ranks on per-reach ratios such as likes per reach, so a quiet start drags those ratios down while the post is still finding its audience.
Fix, organic first: publish when your followers are most active, reply to comments quickly, end with a specific question that is easy to answer, and warm the audience with a Stories teaser. These cost nothing and build real two-way interaction. Where paid seeding fits: after a long quiet spell, some creators choose to revitalize comment sections with SoldOutX or restore baseline post likes so new posts don’t launch to silence. Treat that as a limited supplement, not a substitute for strong content, and weigh the trade-offs. Instagram has said since 2018 that services generating inauthentic likes, follows and comments breach its Community Guidelines and Terms of Use, and that it uses machine learning to find and remove such activity. Purchased interactions also cannot create watch time or sends, the signals Instagram weights most, and they can blur your analytics unless you log when you used them.
What stabilisation looks like: judge recovery over two to three weeks of posts, not one. Track reach per post, follower reach rate, sends per reach and likes per reach. Once likes and comments settle into a steady range, ranking systems have consistent evidence to work with, and later posts launch from a firmer footing. The real test comes when any seeded activity stops: if organic reach, watch time and sends hold, the baseline is rehabilitated. If they sag, the content or hook still needs work.
How to Calculate Engagement by Reach (The Real 2026 Metric)
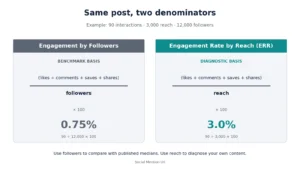
Engagement rate by reach (ERR) divides total interactions by the number of people who actually saw a post, then multiplies by 100. Unlike engagement by followers, it isn’t diluted by followers who never saw the post, which makes it the cleaner diagnostic. The formula is ERR = (likes + comments + saves + shares) ÷ reach × 100. The follower-based version swaps reach for follower count.
The same post measured two ways: engagement by followers (0.75%) and engagement rate by reach (3.0%).
Take a post with 90 interactions, 3,000 reach and 12,000 followers. Engagement by followers is 0.75%; ERR is 3.0%. Now read the pattern across several posts. If the follower-based rate falls while ERR holds steady, fewer followers are being reached, which points to Cause 2 or a distribution problem. If ERR falls while reach is stable, the people who see your posts are less moved by them, which points to Causes 3 and 4. No platform publishes one official formula, but reach-based rates mirror the per-reach signals Instagram says it ranks on. Pick one definition of interactions and keep it consistent.
Frequently Asked Questions
If you only have a minute, run three checks: compare yourself with the benchmark, compare reach with follower count, and read your retention graph. Those separate platform-wide decline, audience problems and content problems. The answers below cover the questions readers ask most.
Is social media engagement dropping for everyone in 2026?
No. Rival IQ’s 2026 data shows Instagram sliding, Facebook flat and X rebounding, with TikTok softer but still highest. Beauty and Retail sat near the bottom on Instagram, so compare against similar accounts and the same metric definition before assuming you’re an outlier.
How do ghost followers hurt my algorithmic reach?
They mainly drag down your percentage rather than directly cutting reach, and Instagram hasn’t confirmed any penalty for inactive followers. The risk is indirect: a dormant audience can weaken early likes and sends the signals that help posts travel further.
What is the difference between engagement by followers and engagement by reach?
Engagement by followers divides interactions by your follower count, the basis Rival IQ uses for its benchmarks. Engagement by reach divides by people who actually saw the post. Use followers to compare with published medians and reach to diagnose your own content.
Does posting too often lower your engagement rate?
It can. Instagram publishes no frequency penalty, but extra weak posts often lower interactions per post and dilute watch time and sends. If engagement by reach drops as volume rises, cut frequency and reinvest that time in fewer, stronger posts.
How can I quickly recover a dropping engagement rate?
Run a one-week audit: remove obvious spam followers, rewrite your next three hooks, publish fewer but stronger posts, reply to comments promptly and track engagement by reach. Expect gradual improvement over several weeks rather than an overnight rebound, and judge it by trend.
Final Verdict
A falling engagement rate is rarely one problem. Benchmark it first, use reach, retention and send data to find which cause applies, fix that one before touching the others, and judge progress by reach-based rates over several weeks, not by a single post. Start with the benchmark check and the ERR calculation this week: together they show where to look next.
