


Social media algorithms rank content by predicting how likely an individual user is to watch, finish, save, and share a post based on real-time behavioural data rather than follower count. Across Instagram, TikTok, YouTube Shorts, and Facebook, AI discovery engines test every new upload with a small initial audience cohort before unlocking broader non-follower distribution. This social media algorithms guide explains how social algorithms work in 2026, breaks down the exact algorithm ranking signals on each network, and gives you a repeatable system for beating social media algorithms through retention engineering, early engagement velocity, and social SEO.
Quick Summary Box: How 2026 Social Media Algorithms Work
Direct Summary: Modern social media algorithms operate as AI-driven interest graphs that evaluate content quality at the post level. Platforms score every upload using watch time completion rate, private shares, saves, and keyword metadata before expanding reach from small test cohorts to broad discovery feeds.
- Prioritise retention over raw views: Achieving a 65% to 75% watch time completion rate is the primary gatekeeper for passing initial algorithmic testing on short-form video feeds.
- Optimise for high-intent actions: Algorithms weight DM sends, reposts, and bookmarks far higher than passive likes because they indicate deep utility and personal endorsement.
- Win the first 60 minutes: High engagement velocity within the opening hour trains the platform’s retrieval layer to push your post into wider recommendation wave.
- Train multimodal indexing: Aligning keywords across spoken audio, on-screen text, captions, and alt text ensures AI classifiers match your post with the right initial test audience.
Master Signal Table: 2026 Platform Ranking Weightings Compared
The comparison below synthesises cross-platform ranking documentation and Sprout Social data on AI discovery engines and non-follower feed distribution across the four dominant networks:
| Platform | Primary Discovery Engine | #1 Weighted Ranking Signal | #2 Weighted Ranking Signal | #3 Weighted Ranking Signal | Primary Suppression Trigger |
|---|---|---|---|---|---|
| Instagram (Reels & Feed) | Multi-Surface AI (Connected Feed vs Unconnected Reels/Explore) | Watch time & loop completion rate | DM sends (“sends per reach”) for unconnected discovery | Bookmark saves & carousel dwell time | Visible third-party watermarks & sub-3-second swipe-aways |
| TikTok (For You Feed) | Pure Interest-Graph Recommender System | Full video completion rate (65%+ target) | Rewatch loops & off-platform shares | Saves to Favourites & search keyword match | Unoriginal reposted clips & early “Not Interested” taps |
| YouTube Shorts | Two-Phase “Explore & Exploit” Seed Engine | Viewed vs. Swiped Away ratio (70%+ stayed to watch) | Engaged views & average percentage viewed | Session time contribution & related video clicks | High opening 2-second swipe-away rate & misleading metadata |
| Facebook (Feed & Reels) | AI Discovery Engine & Meaningful Social Interactions (MSI) | 60-second+ video retention & Reels completion | Multi-sentence threaded comment discussions | Group shares & private Messenger forwards | Engagement bait, external link posts & “Show Less” feedback |
1. The Shift from Follower Graphs to AI Interest Graphs
Social media platforms have replaced chronological follower feeds with AI-driven interest graphs that recommend content based on topic relevance and viewer behaviour. Consequently, an account with zero followers can reach thousands of non-followers if its post satisfies retention and engagement benchmarks.
Under the legacy social graph model, distribution depended almost entirely on who already followed your profile. When you published an update on Facebook or Instagram, the system retrieved posts from a user’s followed accounts and ranked them by relationship closeness and recency. While connected reach still governs surfaces like Instagram Stories and the “Following” tab, primary feeds across Instagram, TikTok, YouTube Shorts, and Facebook now operate as AI discovery engines designed to surface unconnected content.
Instead of matching posts to an existing follower list, modern recommendation engines use transformer-based machine learning models to map both users and individual pieces of content into high-dimensional vector spaces. Every time a viewer pauses on a carousel, rewatches a 30-second tutorial, or taps a comment thread, the system updates their real-time interest profile. According to the 2026 Sprout Social Content Strategy Report, short-form video on TikTok and Instagram Reels remains the strongest vehicle for non-follower discovery because video playback generates dense, second-by-second behavioural telemetry that static images cannot match.
| Dimension | Legacy Social Graph (Follower-First) | 2026 AI Interest Graph (Discovery-First) |
|---|---|---|
| Primary Distribution Pool | Existing followers, friends, and first-degree connections | Both connected and unconnected users, with recommendations influenced by predicted interests and content relevance |
| Core Evaluation Unit | Account relationships, previous interactions, and content engagement | Predicted user interest and content-level signals, including watch time, retention, shares, and other engagement behaviours |
| Content Categorisation | Captions, hashtags, account information, and user interaction signals | Machine-learning analysis of visual content, audio, text, metadata, and user behaviour, with capabilities varying by platform |
| Strategic Implication | Build relevant follower relationships and encourage consistent engagement to strengthen distribution opportunities | Create relevant, original content that attracts attention, retains viewers, and earns meaningful engagement beyond the existing follower base |
To audit whether your account is capturing interest graph distribution, open your native platform analytics and inspect your Followers vs. Non-Followers reach split:
- Check your baseline unconnected ratio: On Instagram Reels and TikTok, healthy discovery-optimised posts typically generate 60% to 85% of their impressions from non-followers, whereas static connected posts skew heavily toward existing followers.
- Isolate standalone comprehension: Because non-followers have zero context about who you are, strip insider jargon and personal backstory from the opening three seconds of every discovery post.
- Align format with surface intent: Use Reels, TikToks, and YouTube Shorts to acquire cold audiences through the interest graph, then use Instagram Stories, Carousel deep dives, and Facebook Groups to nurture those new followers via relationship signals.
2. Ranking Signal Hierarchy: Watch Time, Saves, and Shares
Algorithm ranking signals follow a strict value hierarchy weighted by user effort: watch time and completion rate rank first, followed by private shares and reposts, bookmark saves, substantive comments, and finally passive likes, which carry the lowest distribution weight in 2026 .
Understanding why platforms weight signals in this exact order (Watch time > Shares/Reposts > Saves > Comments > Likes) comes down to platform economics. Social networks monetise attention through advertising inventory—representing $276 billion in global social ad spend—which means their machine learning models reward content that extends session duration and triggers peer-to-peer distribution. A double-tap like takes less than half a second and requires almost zero cognitive commitment. By contrast, watching a 45-second video to completion, forwarding it to a colleague via Direct Message, or bookmarking a checklist for future reference proves genuine utility.
Head of Instagram Adam Mosseri has explicitly confirmed that watch time and sends per reach (DM shares divided by total unique viewers) are decisive signals for unconnected reach, while likes carry relatively more weight only among existing followers . When you study proven ways to boost social engagement fast, you quickly notice that high-performing creators design each asset around a specific high-tier signal rather than begging for generic likes:
- Watch Time & Completion Rate (Tier 1 — Retention Gate): Platforms track both total seconds watched and the percentage of viewers who reach the final frame or loop back to the beginning. On YouTube Shorts, the algorithm separates passive loops from “Engaged Views” where a viewer deliberately stays past the opening seconds
- Shares & Reposts (Tier 2 — Viral Multiplier): Sending a Reel via DM, copying a TikTok link to WhatsApp, or reposting to a feed brings another user back into the app. Because private shares represent trusted personal endorsements, algorithms treat high share rates (typically 1.5% to 3%+ of views) as the primary trigger for cross-cluster expansion.
- Saves & Bookmarks (Tier 3 — Utility Anchor): Saving a post signals that the content holds evergreen reference value. To accelerate this specific signal on reference carousels and tutorials, many creators pair save-worthy frameworks with authentic Instagram saves from SoldOutX to strengthen early bookmark ratios and extend post shelf life in Explore.
- Substantive Comments (Tier 4 — Discussion Depth): Modern natural language classifiers distinguish between single-emoji replies and multi-sentence discussions. On Facebook and LinkedIn, threaded replies exceeding 10 words carry substantially more ranking weight than top-level one-word comments.
- Likes (Tier 5 — Baseline Validation): Likes still contribute to overall popularity scoring inside connected feeds (About Instagram), but a high like-to-view ratio alone will rarely push a video past its initial test tier if watch time and shares are weak.
To engineer your content for the top three signals, match your creative structure to the action you want the viewer to take:
- Build “Save-First” Reference Assets: Include a dense, scannable checklist, budget breakdown, or tool stack on the final slide of a carousel or the closing three seconds of a Reel so viewers must bookmark the post to apply it later.
- Write “DM-Trigger” Hooks: Frame topics around shared identity or team workflows (for example, “Send this to the designer who always asks for one more revision”) to stimulate private sends per reach .
- Use Seamless Loop Transitions: Edit short-form scripts so the final spoken sentence flows grammatically into the opening hook, prompting viewers to watch the first 2 to 3 seconds a second time while reading the caption.
3. How the “Test Cohort” Decides Your Post’s Fate in the First 60 Minutes
When you publish a post, the algorithm shows it to an initial test audience cohort of 200 to 500 users within the first 60 minutes. If your watch time and engagement rates clear platform benchmarks, the system unlocks wider distribution waves.
Every creator has experienced the frustrating “200-view jail” on TikTok or the 300-view ceiling on Instagram Reels and YouTube Shorts. That plateau is not a shadowy penalty; it is the standard multi-stage retrieval architecture in action. As YouTube Shorts Product Lead Todd Sherman explains regarding the platform’s “explore and exploit” framework, short-form feeds cannot rely on thumbnail click-through rate because videos autoplay as users scroll. Instead, the algorithm enters an explore phase by serving your newly uploaded video to a small seed audience selected via your post’s metadata and historical niche cluster.
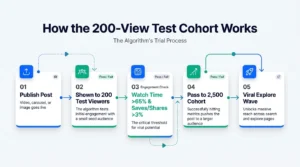
Self-Contained Flowchart Breakdown — How the 200-View Test Cohort Works:
- Publish Post: Multimodal AI scans spoken audio, OCR text, and caption keywords to assign an initial topic vector.
- Shown to 200 Test Viewers: The retrieval engine serves the post to a micro-cohort of warm followers and topic-matched non-followers during the first 60 minutes.
- Check Watch Time (>65%) + Saves/Shares (>3%): The ranking model evaluates whether completion rate and high-intent saves/shares exceed competing candidate posts in the same niche.
- Pass to 2,500 Cohort: Posts that clear the gate enter the exploit phase, expanding to a secondary tier of 2,500 to 10,000 viewers.
- Viral Explore Wave: If retention and share velocity hold across adjacent audience clusters, distribution scales exponentially into broad Explore and For You feeds.
Passing this first-hour diagnostic requires deliberate pre-publish and post-publish execution. Because Instagram’s ranking pipeline pulls roughly 500 eligible candidate posts per user session and scores them in milliseconds, a sluggish start signals to the predictive model that other candidate videos deserve the impression slot.
Follow this three-step protocol to maximise your test audience cohort pass rate:
- Front-Load Visual and Verbal Pattern Interrupts (Seconds 0.0 to 2.0): Eliminate “Hey guys, welcome back” intros. Start mid-action with a high-contrast on-screen headline and an immediate outcome claim so at least 70% to 80% of test viewers stay past the three-second swipe threshold.
- Schedule for Peak Cohort Availability: Analysis of nearly 2 billion engagements across 307,000 profiles by Sprout Social’s data science team shows that publishing during peak active windows—specifically Tuesdays and Wednesdays between 11 a.m. and 6 p.m. local time—reduces the time required to gather your initial 200 test impressions.
- Pace Visual Changes Every 3 to 5 Seconds: Reset viewer attention throughout the middle of your video using B-roll cuts, camera zooms, or on-screen text callouts so your completion curve stays above the 65% threshold needed to graduate to the 2,500-view cohort.
4. How Initial Engagement Velocity Unlocks Viral Distribution
Algorithmic velocity measures how rapidly your post accumulates watches, saves, shares, and comments immediately after publishing. High engagement velocity during the first 30 to 60 minutes signals urgent relevance, prompting recommendation engines to bypass slower cohorts and accelerate viral distribution.
While total engagement matters over a post’s lifetime, engagement velocity—the rate of interactions per hundred impressions per minute—dictates how aggressively the retrieval layer scales your reach . On LinkedIn and Instagram alike, first-hour interaction density accounts for the vast majority of a post’s eventual trajectory. When a post earns 25 saves and 15 DM shares within 30 minutes of going live, the machine learning classifier assigns a high engagement probability score. To help catalyse this early momentum alongside organic community tactics, some creators and agencies incorporate SoldOutX social media growth services to reinforce initial save, share, and social proof metrics during the critical launch window.
However, creators must understand the material limitations of velocity acceleration. Paid or external engagement services can supplement social proof and help nudge interaction counters during the opening window, but they cannot fix weak audience retention or irrelevant content. If your video suffers from a 60% early swipe-away rate, adding surface-level likes or saves while cold viewers immediately scroll past creates a signal mismatch that the algorithm will quickly flatten. Sustainable algorithmic velocity requires combining strong creative retention with an active launch routine:
- Execute a 15-Minute Pre-Publish Warm-Up: Spend 15 minutes before publishing replying to pending DMs, answering comments on your previous post, and leaving thoughtful insights on 5 niche peers’ updates so active users are already visiting your profile when your new post drops.
- Cross-Promote to High-Closeness Surfaces Immediately: Within two minutes of publishing a Reel or YouTube Short, share a teaser preview to your Instagram Stories or broadcast channel with a specific reason to tap through, funnelling your warmest followers into the initial test cohort.
- Seed Multi-Sentence Comment Threads: Pin a provocative question as the first comment under your own post and reply to every early commenter with an open-ended follow-up question within the first 30 minutes, doubling your comment velocity and increasing dwell time as viewers pause to read the thread.
5. Social SEO: Training Algorithms to Categorize Your Niche
Social SEO is the practice of embedding target keywords into your spoken audio, on-screen text, captions, and alt text so AI classifiers accurately categorise your content and serve it to high-intent users via both search results and recommendation feeds.
Roughly two-thirds of consumers now use social platforms as active search engines, and recommendation algorithms rely on the exact same semantic indexing layer to match new uploads with their initial test audience cohort. If the AI does not know precisely who your video is for before serving the first 200 impressions, it will test your content on a random, poorly matched audience—resulting in immediate swipe-aways that kill your reach. Rather than relying on outdated blocks of 30 generic hashtags, 2026 algorithms use optical character recognition (OCR), automated speech-to-text transcription, and natural language processing to build a semantic topic vector from four distinct zones of your post.

Self-Contained Diagram Breakdown — The 4 Social SEO Indexing Zones
- Spoken Audio Captions (Speech-to-Text): Platform AI transcribes every word you say. Speaking your primary keyword phrase aloud within the first 3 to 5 seconds anchors your video’s transcript to that exact search query.
- On-Screen OCR Text (Visual Frame Parsing): Computer vision models read native text overlays placed on the video canvas, especially the title banner displayed during seconds 0 to 3 .
- Semantic Caption Keywords (NLP Context): The first two sentences of your written caption and 3 to 5 targeted niche hashtags provide structured topic context without triggering spam filters .
- Custom Alt Text & File Metadata (Accessibility & Classification): Custom accessibility alt text on Instagram and descriptive titles on YouTube Shorts explicitly tell the classifier what appears visually in the frame.
To train the algorithm to categorise your niche with high confidence, implement this four-zone alignment checklist before hitting publish:
- Script Your Primary Keyword into the Opening Hook (Zone 1): Instead of saying “Here is how to fix this,” say “Here is how to fix your watch time completion rate on Instagram Reels” within the first four seconds so the auto-generated captions index the exact phrase.
- Place Native On-Screen Text in the Safe Zone (Zone 2): Type your core topic headline using the platform’s native text tool (or clean high-contrast lettering) in the upper-centre third of the 9:16 frame so OCR scanners parse it immediately.
- Write a 2-Sentence Semantic Lead in Your Caption (Zone 3): Open your caption with a natural, keyword-rich summary of the problem and solution, and cap hashtags at 3 to 5 hyper-specific niche tags—for example, using #InteriorDesignTrends (484,000 posts) rather than oversaturated #InteriorDesign (175 million posts).
- Populate Custom Alt Text and Topic Tags (Zone 4): Before publishing on Instagram or Facebook, open Advanced Settings → Write Alt Text and enter a clear, factual 15-to-25-word description incorporating your primary entity and niche context.
6. 5 Negative Signals That Quietly Throttle Your Organic Reach
Negative ranking signals tell social media algorithms that your content degrades user satisfaction or violates platform quality standards. High early swipe-away rates, visible cross-platform watermarks, “Not Interested” taps, spammy keyword stuffing, and erratic niche switching actively suppress organic reach .
Beating social media algorithms requires eliminating the friction points that cause recommendation models to down-rank your posts before they ever leave the test cohort. Across official documentation from Instagram, TikTok, and Meta, five specific negative signals account for most sudden drops in organic impressions:
- Sub-3-Second Swipe-Aways: Both Instagram Reels and YouTube Shorts track the exact percentage of viewers who scroll away within the first three seconds . On YouTube Shorts, if your “Swiped Away” rate exceeds 40% to 50% (meaning your “Viewed” rate drops below 50%–60%), the seed audience test terminates prematurely.
- Recycled Watermarks and Unoriginal Aggregated Clips: Instagram’s originality engine and Recommendation Guidelines explicitly demote low-resolution videos, muted clips, videos that are majority static text, and Reels bearing visible watermarks or borders from other apps like TikTok or CapCut . Similarly, TikTok filters duplicated or unoriginal uploads out of For You feed eligibility. Always export clean, uncompressed master files and finish text styling natively when possible.
- Explicit Negative User Feedback (“Not Interested”, Hides, and Mutes): Users now exercise direct control over their feeds via “Not Interested” buttons, keyword filters, and account mutes, alongside Meta’s conversational AI feed controls. Even a handful of “Hide Post” or “Report” actions during the initial 200-view test cohort heavily penalises a post’s predicted value score.
- Hashtag Stuffing, Engagement Bait, and Outbound Link Penalties: Modern semantic AI classifiers on X, LinkedIn, Facebook, and Instagram flag blocks of 20+ irrelevant hashtags or manipulative engagement bait (“Comment YES if you agree!”) as low-quality spam. Furthermore, placing external URLs directly in the body of Facebook or LinkedIn posts often depresses feed distribution because outbound links end user sessions early.
- Niche Whiplash and Deleting Underperforming Posts: Because transformer-based algorithms build a cumulative content embedding for your profile, jumping erratically between unrelated topics (such as posting a gaming clip on Monday, a tax guide on Wednesday, and a cooking vlog on Friday) confuses the audience matching model. Additionally, repeatedly deleting low-performing videos removes valuable training data and resets baseline reach.
Frequently Asked Questions
These five self-contained answers address the most common operational questions creators and marketers ask about how social media recommendation systems evaluate, test, and scale organic content across Instagram, TikTok, YouTube Shorts, and Facebook in 2026.
1. How do social media algorithms decide which posts go viral?
Social media algorithms push posts to viral reach through progressive cohort testing. When a post achieves high watch time completion (over 65%) and strong save or share rates (over 3%) within its initial 200-to-500-viewer test cohort, the AI expands distribution exponentially.
2. What is the difference between a social graph and an interest graph?
A social graph distributes content primarily to accounts that already follow you or share mutual connections. An interest graph uses AI embeddings to recommend your content to non-followers based on topic relevance, viewing history, and real-time behavioural engagement signals.
3. Why do saves and shares matter more than likes in 2026?
Saves and private DM shares require deliberate user effort and indicate deep content utility or personal endorsement. Algorithms weight these high-intent actions heavily because bookmarks drive repeat sessions and shares bring new viewers directly back onto the platform.
4. How does the initial test audience cohort work on Instagram and TikTok?
Within the first 60 minutes of publishing, Instagram and TikTok serve your post to a seed cohort of 200 to 500 topic-matched users. Clearing retention and engagement velocity thresholds unlocks secondary cohorts of 2,500+ viewers and broader Explore or For You waves.
5. Does posting frequency affect algorithmic ranking?
Posting frequency does not boost individual post quality scores, but consistent cadence (such as 3 to 5 weekly posts) trains the AI’s content embedding model faster. Erratic gaps cause the algorithm to lose confidence in your audience cluster, resetting baseline reach.
Final Verdict
Winning organic reach in 2026 requires aligning your creative workflow with AI interest graphs: hook viewers within two seconds, engineer 65%+ watch time completion, trigger saves and private shares in the first hour, and index every post with multi-zone social SEO .
Rather than chasing short-lived platform tricks, treat every upload as a self-contained data package designed to pass the 200-view test cohort gate. Before publishing your next five posts, run this rapid diagnostic framework
- If your reach stalls below 300 views: Your content is failing the initial test cohort check. Audit your 3-second “Viewed vs. Swiped Away” rate and rewrite your visual and spoken hooks.
- If your completion rate exceeds 65% but non-follower reach plateaus at 1,500–3,000 views: Your video holds attention but lacks viral expansion triggers. Add a concrete saveable summary frame or a conversational DM share prompt to lift your save and send rates past 3%.
- If your views come almost entirely from unrelated geographies or off-target audiences: Your topic vector is misaligned. Synchronise your spoken keywords, on-screen OCR text, semantic caption lead, and custom alt text around one consistent niche cluster.
