


Quick Summary
The top social media metrics to track in 2026 are ratios, not totals: hook hold rate, engagement rate by reach, amplification rate, save rate, profile conversion and click-through rate. Each follows one formula: (people who acted ÷ people who could have) × 100.
Raw views, follower totals and likes are the classic vanity metrics: easy to report, hard to act on. Ratios work harder. Instagram’s Adam Mosseri has named watch time, likes per reach and sends per reach as the top three ranking signals, and Sprout Social research shows 65% of marketing leaders need to prove social supports business goals to win leadership buy-in. Ratios serve both audiences: the algorithm and the boardroom.
Benchmarks below are Instagram-focused. Where no published figure exists, the table says so rather than inventing one.
| Metric | Formula | 2026 benchmark | Funnel stage |
|---|---|---|---|
| 3-second hook hold rate | (Views past 3 seconds ÷ total views) × 100, or 100% − skip rate | No official figure; about 50% is described as average, and below 70% is worth retesting | Discovery |
| Engagement rate by reach (ERR) | (Likes + comments + shares + saves) ÷ reach × 100 | Your 90-day median; the follower-based industry average is about 0.48% (Socialinsider) | Authority |
| Amplification rate | (Sends + shares) ÷ reach × 100 | No published figure; use your own median | Authority |
| Save rate (save-to-impression ratio) | (Saves ÷ views or reach) × 100 | Typically 1–2%; 3%+ is strong (vendor guidance) | Authority |
| Profile visit-to-follower conversion | (New followers ÷ profile visits) × 100 | Roughly 13–18% (Flick, to January 2025) | Revenue |
| Click-through rate (CTR) | (Link clicks ÷ profile visits or impressions) × 100 | Bio links: about 1–3% | Revenue |
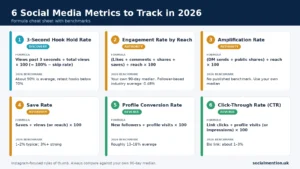
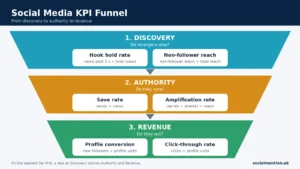
Measuring social media success works best in funnel order. Discovery metrics show whether strangers stop, authority metrics show whether they care, and revenue metrics show whether they act. A weak tier starves the next one, which is why these key social media KPIs are grouped this way. Pull 90 days of Insights first, because for most of these ratios your own median is a better yardstick than any industry average.
1. 3-Second Hook Hold Rate & Average Watch Time (Discovery)
Hook hold rate is the percentage of Reel views that pass the first three seconds, calculated as views beyond 3 seconds ÷ total views × 100, or 100% minus Instagram’s skip rate. It shows whether your opening earns the rest of the watch.
Instagram replaced its old view rate with skip rate, the share of views from people who skip within the first three seconds, and added a retention chart showing where viewers leave. Instagram publishes no benchmark. Practitioner guides describe a hold rate near 50% as average and suggest retesting hooks when skip rate stays above about 30%. Treat 70% as a sensible working target and your own recent median as the real baseline.
Average percentage viewed (average watch time ÷ video length × 100) catches what the hook misses: a strong opening followed by a mid-video collapse. A 9-second average watch on an 18-second Reel scores 50%. The same 9 seconds on a 40-second Reel scores 22.5%, a cue to cut the video shorter.
To improve both:
- Pull skip rate and average watch time for your last 15 Reels.
- Calculate hold rate and average percentage viewed for each.
- Group Reels by opening style (face to camera, on-screen claim, visual surprise) and compare medians.
- Rewrite only the first three seconds of your weakest Reel and retest on a similar topic.
2. Engagement Rate by Reach (ERR) vs Follower Count
Engagement rate by reach (ERR) is the share of unique viewers who interact with a post, calculated as (likes + comments + shares + saves) ÷ reach × 100. Unlike follower-based rates, it measures content quality among the people who actually saw it.
The formula matters more than the number. Socialinsider’s analysis of 35 million posts puts the 2025 average follower-based rate (likes plus comments ÷ followers) at 0.48%, down about 24% year on year, and its Q3 2026 update shows Reels at 0.48% and carousels at 0.50%. Studies using other formulas publish different medians, so a benchmark quoted without its formula is not comparable with your dashboard.
In the engagement vs reach metrics debate, use each version for its job. Follower-based rates suit competitor comparisons, because only the account owner can see reach. ERR suits diagnosing your own content. Read it beside the non-follower share of reach: a post pushed to strangers can show a lower ERR than one seen mostly by loyal followers without being weaker. As a simple trigger, calculate ERR for your last 20 posts and investigate any post below half your median.
3. Amplification Rate (DM Sends & Public Shares)
Amplification rate is the proportion of viewers who pass a post on, calculated as (DM sends + public shares) ÷ reach × 100. It is the closest practical measure of virality because each share is a personal recommendation to a new audience.
Mosseri has said likes per reach matter slightly more for content shown to followers, while sends per reach matter more for content shown to people who don’t follow you. Insights typically reports shares rather than sends, so treat shares as your nearest proxy. A Reel that reaches 20,000 people and earns 300 shares and sends has a 1.5% amplification rate. Virality rate, which divides shares by views instead, is a close variant. Instagram publishes no benchmark, so judge the figure against your own median and watch the trend.
Track it beside the non-follower share of reach, the cleanest read on discovery. If both climb together, the post is escaping your existing audience. To lift it, write for the recipient rather than the viewer: a relatable moment, a useful checklist or a statistic worth forwarding to a colleague.
4. Save-to-Impression Ratio (Content Authority Signal)
Save-to-impression ratio is the percentage of views that end in a save, calculated as saves ÷ impressions × 100. Instagram has largely replaced impressions with views, and many analysts divide by reach instead; pick one denominator and keep it constant.
Saves signal intent to return, which makes them a stronger quality marker than a like. No platform publishes a save benchmark; vendor guides commonly cite 1–2% as typical and 3% or more as strong, so treat those as rough guides. Socialinsider’s 2025 data shows carousels earned the most or equal-most saves at every account size: accounts with 10,000–50,000 followers averaged 8 saves per carousel, 7 per Reel and 3 per image.
To strengthen a weak save rate, build posts people keep: checklists, benchmarks, templates and step-by-step explainers. Put the useful part on slides two and three, make the cover promise something specific, and end with a plain “save this for later” cue.
Some brands also use paid support to seed early traction on strong educational posts. If you test it, strengthen your save-to-impression ratio with SoldOutX on content that already performs, and go in with open eyes. Instagram’s Community Guidelines ask users not to artificially collect likes, followers or shares, and Instagram has said third-party apps that generate inauthentic engagement violate its terms. Purchased saves also come from people with no real intent, so they can lift the ratio without lifting profile visits or clicks. Judge any test on those downstream metrics, not on saves alone.
5. Profile Visit-to-Follower Conversion Rate
Profile visit-to-follower conversion rate is the percentage of profile visitors who follow, calculated as new followers ÷ profile visits × 100. It tests whether your bio, grid and pinned content turn curiosity into an audience. Pair it with net follower growth rate to see retention.
Benchmarks are patchy. Flick’s benchmark data put the average between roughly 13% and 18% from late 2024 to January 2025, with the lower figure drawn from a smaller sample. Net follower growth rate is (new followers − unfollows) ÷ starting followers × 100. Socialinsider’s 2025 data puts average audience growth at about 22% for accounts with 1,000–5,000 followers and about 11% for those with 100,000 to one million, both well below 2024.
To strengthen conversion organically, treat the profile as a landing page. Open the bio with who it’s for and what they get, pin three posts that prove it, and keep Highlights for reviews and FAQs. Then point your Reels at the profile with one specific reason to follow.
Brands relaunching a profile sometimes add paid followers to seed social proof. If you test it, build verified follower authority with the same caution as above. Purchased followers arrive without a profile visit, so they inflate the numerator of this ratio and make it meaningless for that period. Annotate the dates, exclude them from conversion analysis, and keep tracking organic conversion alongside.
6. Click-Through Rate (CTR) and Bio Link Conversions
Click-through rate (CTR) is the percentage of people who see a link or call to action and click it, calculated as clicks ÷ impressions × 100. For a bio link, divide clicks by profile visits instead. It is the first step from attention to revenue.
CTR varies by placement, so benchmark each one separately. Sprout Social notes that CTRs vary widely across industries, networks and content types, and a widely cited guide puts a typical bio-link rate at 1–3% of profile visits. Use that as a rough guide and track your own trend.
A click only counts when it lands. Tag every social link with UTM parameters so Google Analytics can show sessions and conversions by post, then compare clicks with sessions. A large gap points to a slow or mismatched landing page rather than a weak caption. Track revenue per click alongside CTR so you can tell a cheap click from a valuable one.
Improving the rate itself is a separate discipline, covered in our guide to increasing your social media click-through rate. The measurement habit comes first: one destination per campaign, tagged consistently, so every click can be traced to revenue.
Frequently Asked Questions
Which social media metric is most important in 2026?
It depends on your goal. For reach, watch time, likes per reach and sends per reach are the three signals Instagram’s head Adam Mosseri has named. For revenue, profile conversion and click-through rate matter most. Track one metric per funnel stage.
How do you calculate Engagement Rate by Reach (ERR)?
Divide total engagements (likes, comments, shares and saves) by the post’s reach, then multiply by 100. For example, 450 engagements on 9,000 reach is 5%. State your formula whenever you share the figure, because published benchmarks use different ones.
What is a good 3-second hook hold rate for short-form video?
Instagram publishes no official benchmark. Practitioner guides describe about 50% as average and suggest retesting hooks when hold falls below roughly 70%, but your own median across recent Reels is fairer, because niche and length shift results. Hold rate equals 100% minus skip rate.
Why is Save Rate a better quality indicator than Like Count?
A like costs a tap; a save signals intent to return, so it separates useful content from passing approval. Likes inflate easily on entertaining posts, while saves cluster on reference content. Track save rate alongside profile conversion to confirm that interest turns into action.
How often should brands audit their social media KPIs?
Review the six ratios monthly for health checks and quarterly for strategic shifts, matching the cadence Sprout Social recommends. Re-baseline whenever the platform changes its analytics, as Instagram did when it swapped view rate for skip rate, or when your strategy changes.
Final Verdict
You do not need every ratio on day one. If you can track only three, choose hook hold rate for discovery, save rate for authority and profile visit-to-follower conversion for revenue. Together they show whether strangers stop, care and follow. Add amplification, ERR and CTR once you have a 90-day baseline, and re-baseline whenever Instagram changes its analytics. Whatever you decide about paid support, a ratio only predicts business results while the behaviour behind it is real. Start with your own median, change one variable at a time, and report ratios rather than totals.
