


Quick Summary Box
Understanding how brands vet creators for roi requires looking past surface follower counts to audit six weighted performance signals. In 2026, UK and US marketing teams evaluate last-12-post engagement consistency, comment thread depth, verified first-party audience geography, save-to-share ratios, production standards, and brand safety before approving campaign budgets.
For performance-focused marketing teams and PR agencies, creator partnerships are no longer experimental awareness plays; they are accountable media channels measured by customer acquisition cost (CAC), earned media value, and return on ad spend (ROAS). Two creators in the same vertical can hold identical follower counts of 25,000, yet one generates five-figure tracked revenue while the other fails to produce a single checkout conversion. The difference lies in audience trust, demographic concentration, and algorithmic consistency rather than top-line reach.
To separate high-converting partners from inflated vanity profiles, agencies rely on a structured influencer audit checklist combining third-party discovery databases with manual forensic inspection. Below is the exact 6-point weighting model that UK and US brands use to score creator profiles, calculate realistic campaign economics, and filter out engagement manipulation before issuing a contract.
The 6-Point Brand Vetting Scorecard Table
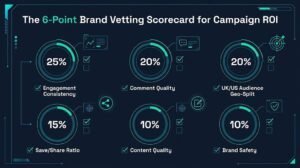
According to Modash vetting research and current agency qualification standards, modern creator audits assign weighted scores across quantitative reach metrics and qualitative community signals rather than relying on a single pass-or-fail number
| Metric | Target Benchmark | Red Flag | Scorecard Weight |
|---|---|---|---|
| 1. Last-12-Post Engagement Consistency | Median engagement rate within 20% of the 12-post mean; steady non-pinned view velocity | One viral outlier carrying 80% of total views while recent posts stall under 1% engagement | 25% |
| 2. Authentic Comment Threads | Topic-specific questions, product enquiries, multi-word discussions, and active creator replies | Single-word praise, repetitive emoji strings, or automated pod comments within five minutes of posting | 20% |
| 3. UK/US Audience Geo-Split | Over 60% combined follower concentration in target UK and US buyer markets with core age alignment | Less than 35% tier-one market concentration or sharp mismatch between creator location and audience location | 20% |
| 4. Save/Share Ratio | Combined saves and shares reaching 10% to 20% of total likes on educational or product-led posts | High like counts accompanied by near-zero saves or shares, signalling passive or purchased interactions | 15% |
| 5. Visual Production Quality | Crisp lighting, clear audio, strong 3-second hook retention, and natural product storytelling | Poor audio mixing, unedited rambling, or jarring hard-sell scripts that alienate regular viewers | 10% |
| 6. Brand Safety & Feed Saturation | Clean historical footprint, GARM compliance, and sponsored content ratio kept under 25% of total posts | Over 30% sponsored posts, undisclosed ads, recent promotions for direct competitors, or polarising controversies | 10% |
CMS GRAPHIC CALLOUT 1 — SCORECARD INFOGRAPHIC
- Placement: Immediately after Quick Summary Box & Scorecard Table
- Target Slug / Asset Name: 6-point-brand-creator-vetting-scorecard (WebP format)
- SEO Alt Text: 6-point brand influencer vetting scorecard for campaign ROI
- Design Content: The 6-Point Brand Vetting Scorecard Graphic: 1. Last-12-Post Engagement Consistency (25%), 2. Authentic Comment Threads (20%), 3. UK/US Audience Geo-Split >60% (20%), 4. Save/Share Ratio (15%), 5. Visual Production Quality (10%), 6. Brand Safety (10%).
How Brands Discover Creators in 2026 (Search Filters & Keywords)
PR agencies and brand marketers discover creators by layering demographic, engagement, and keyword filters inside influencer databases like Modash, Upfluence, and native Creator Marketplaces, reducing thousands of profiles into a vetted shortlist of 20 to 30 high-fit candidates.
Discovery and vetting perform two distinct jobs in an influencer campaign workflow. Discovery casts a structured net to surface relevant candidates, whereas vetting applies forensic stress tests to predict commercial conversion. Rather than scrolling Instagram Explore or TikTok’s For You feed manually for hours, performance marketers begin inside dedicated intelligence platforms—specifically Modash, Upfluence, Grin, and native Meta or TikTok Creator Marketplaces—where they can filter millions of public profiles simultaneously.
As detailed in the Modash Brand Influencer Vetting Report, experienced campaign managers avoid applying ten restrictive filters at once, which often chokes search volume and hides emerging talent. Instead, they stack discovery criteria in three progressive waves:
- 1. Baseline Audience & Tier Calibration: Marketers first set the creator’s primary country (United Kingdom or United States), minimum audience location threshold (typically at least 50% in target shipping regions during initial discovery), follower bracket (such as 10,000 to 75,000 for micro-creators), and minimum engagement floor (commonly 2% on Instagram or 4% on TikTok).
- 2. Semantic Bio, Hashtag, and Credential Filtering: Once the geographic and size pool is defined, teams filter by five specific keyword categories:
- Niche descriptors: e.g., “strength training”, “clean beauty”, “personal finance”.
- Product or category terms: e.g., “mineral SPF”, “ergonomic desk”, “protein supplement”.
- Professional credentials: e.g., “registered nutritionist”, “chartered accountant”, “esthetician”.
- Platform communities: e.g., “#BookTok”, “#RunClubUK”, “#SkinCycling”.
- Format markers: e.g., “GRWM”, “honest review”, “day in my life”.
- 3. Lookalike Expansion & Brand-Affinity Mining: After identifying three to five ideal creators, agencies run automated lookalike searches based on either content similarity or audience overlap. Simultaneously, D2C brands import their existing customer email lists or scan tagged brand mentions to uncover micro-creators who already purchase and advocate for their products organically.
During this discovery stage, marketers also apply negative filters—such as competitor collaboration exclusions—to automatically remove creators who have promoted a rival brand within the past 90 to 180 days. Only the profiles that survive this multi-layered database screening move forward to the manual 6-point vetting audit.
Check 1: Engagement Consistency Across the Last 12 Posts
Brands audit engagement consistency by inspecting a creator’s last 12 non-pinned posts, comparing median views and likes against headline averages to filter out one-hit viral outliers, erratic posting gaps, and artificial engagement spikes before negotiating campaign deliverables.
Headline engagement rates displayed on media kits or automated profile summaries frequently mislead inexperienced buyers. If a creator published one viral Reel four months ago that generated 1.2 million views, while their subsequent eleven videos averaged just 1,800 views, their mean engagement rate will still look artificially impressive. When a brand sponsors a post on that account, however, actual delivery will almost always track the median performance of recent uploads rather than the historical viral peak.
To build an accurate influencer vetting metrics model, agency analysts bypass pinned posts—which sit at the top of a profile precisely because they overperformed—and manually log the performance of the 12 most recent chronological feed posts or short-form videos. Specifically, reviewers evaluate four quantitative patterns:
- Median vs. Mean Spread: Analysts calculate the median view count and median like count across the last 12 uploads. When the median sits within 15% to 25% of the average, the creator possesses a reliable baseline audience that consistently consumes their content.
- Organic vs. Sponsored Decay: Every creator experiences some variation between organic storytelling and commercial integrations. However, if organic posts average 15,000 views while #ad posts drop to 1,200 views, either the creator’s commercial integration style feels forced, or the platform algorithm is suppressing overly promotional uploads. Brands also check the sponsored-to-organic ratio across those 12 posts, looking for commercial integrations to remain below 25% (no more than three sponsored posts out of every twelve published).
- Cadence & Posting Gaps: Erratic publishing habits—such as going silent for six weeks and then uploading four posts in forty-eight hours—depress algorithmic distribution. Brands prioritise creators who maintain a steady weekly cadence prior to a campaign launch.
- True CPM Calculation: Rather than pricing a partnership on total follower count, agencies divide the creator’s quoted fee by their median views (in thousands) across the last 12 posts to establish an accurate CPM calculation. Reviewing influencer marketing pricing and rate cards alongside median 12-post view data allows marketers to spot overpriced media kits immediately and negotiate performance-aligned flat fees or hybrid affiliate structures.
If a profile exhibits sudden follower spikes on historical growth charts without corresponding viral posts, or if individual posts show massive like totals with hidden view counts and barren comment sections, the account is flagged for artificial inflation and removed from the shortlist.
Check 2: Comment Section Quality and Community Trust
Marketers evaluate comment quality by reading recent post threads to distinguish genuine buyer intent—such as product questions, peer tagging, and creator replies—from automated bot pods, repetitive emoji strings, and generic praise that generate zero commercial conversions.
While likes and video views measure passive consumption, the comment section reveals whether a creator actually holds persuasive authority over purchasing decisions. Accounting for 20% of the overall vetting scorecard, qualitative comment analysis is where human reviewers catch what automated databases occasionally miss: engagement pods and low-grade bot activity.
When brand analysts open the last six to twelve posts on an Instagram or TikTok profile, they categorise comments into three distinct tiers:
- 1. High-Intent Commercial & Community Signals (Positive): Followers asking specific questions (“Which shade are you wearing?”, “Does this work for sensitive skin?”, “Where is the linen jacket from?”), tagging friends to share recommendations, referencing the creator’s past advice, or sharing personal experiences related to the post topic. Equally critical is whether the creator actively replies to these questions within the first few hours of publication, proving an active two-way relationship.
- 2. Passive Appreciation (Neutral): Brief compliments from real followers (“Love this look!”, “Stunning ❤️”). Every healthy lifestyle or fashion creator receives casual praise, so these comments are normal in moderation, provided they are accompanied by substantive conversation.
- 3. Engagement Pods & Bot Signatures (Dealbreaker Red Flags): Dozens of comments arriving within three minutes of upload from other aspiring influencers who leave generic three-word phrases (“Great post hun”, “Amazing content 🔥”, “So inspiring!”), or spam accounts posting financial scams and unrelated promotional text. Engagement pods artificially trick platform algorithms into initial distribution, but because pod members have zero interest in buying promoted products, pod-heavy accounts consistently deliver dismal ROAS.
From the creator perspective, maintaining an active, discussion-rich comment section is essential before entering brand negotiations. Even skilled creators occasionally experience quiet comment threads when testing new content formats or recovering from an algorithmic dip. To avoid failing initial visual inspections during agency shortlisting, creators combine strong conversational call-to-actions in their captions with strategic social proof—often choosing to strengthen comment section credibility with SoldOutX on flagship portfolio posts so their grid demonstrates lively, contextually relevant discussion rather than an empty thread. For brands and creators alike, the benchmark remains clear: comments must read like natural human dialogue anchored to the specific topic of the video or carousel.
Check 3: Audience Geography and Age Demographics (UK & US Split)

Brands verify audience demographics by cross-referencing third-party authenticity scores with unedited Instagram and TikTok Insights screenshots, confirming that at least 60% of followers reside in target UK or US markets and match core buyer age brackets.
Even the highest engagement rate in the industry generates zero return on investment if the creator’s audience cannot legally or logistically purchase the promoted product. A London-based skincare brand shipping exclusively within the United Kingdom and the United States will lose money sponsoring a UK creator whose viral comedy reel accidentally attracted 75% of their following from regions outside the brand’s fulfillment network.
To prevent geographic waste, agencies run a two-stage demographic verification process. First, they perform a fake follower check and brands rely on inside platforms like Modash or HypeAuditor to calculate an initial audience authenticity score (targeting at least 80% real, active human accounts) and view estimated country and city breakdowns. Second—because third-party tools rely on statistical sampling—marketers request raw, uncropped first-party screenshots (or a 15-second screen recording) directly from the creator’s native Instagram Professional Dashboard or TikTok Studio analytics covering the past 30 days.
CMS GRAPHIC CALLOUT 2 — AUDIENCE INSIGHTS SCREENSHOT
- Placement: Immediately after H2 Check #3, Paragraph 2
- Target Slug / Asset Name: instagram-audience-demographics-brand-audit-screenshot (WebP format)
- SEO Alt Text: Instagram audience demographics screenshot showing UK and US follower split
- Design Content: Annotated Instagram Audience Insights screenshot showing “Top Countries: United Kingdom (54%), United States (22%)” and “Age Range: 25–34 (41%)”.
When inspecting these first-party Insights screenshots, brand auditors verify three specific data points:
- Country & City Concentration (20% Scorecard Weight): For UK and US consumer campaigns, brands typically require a combined UK/US audience share exceeding 60%, with the primary campaign market holding at least 45% to 50%. Localised retail or hospitality campaigns drill down further into “Top Cities” (e.g., London, Manchester, New York, Los Angeles) to confirm regional footfall potential.
- Age Bracket Purchasing Power: If a brand sells a £140 anti-ageing serum or a B2B SaaS subscription, an audience concentrated in the 13–17 or 18–24 brackets rarely possesses the disposable income or pain-point urgency required to convert. Auditors look for strong alignment in the 25–34 and 35–44 demographics where discretionary spending peaks.
- Reached Audience vs. Total Followers: On short-form video platforms, algorithmic reach often diverges from follower demographics. Smart media buyers request both the Total Followers demographic tab and the Accounts Reached demographic tab to ensure recent videos are actually being served to UK and US viewers.
Alongside demographic verification, marketers complete the remaining 35% of the 6-point scorecard by auditing Save/Share Ratios (15%), Visual Production Quality (10%), and Brand Safety (10%). Inside the creator’s analytics screenshot, saves and DM shares act as the strongest proxy for conversion intent: when a viewer saves a routine or forwards a product tutorial to a friend, they are bookmarking a future purchase. Meanwhile, production and brand safety checks ensure the creator films in crisp lighting with clear audio, discloses commercial partnerships transparently under UK ASA or US FTC guidelines, and aligns with Global Alliance for Responsible Media (GARM) safety standards without history of hate speech, copyright infringement, or erratic public controversies.
Check 4: How Creators Prepare Their Profiles to Pass Brand Audits
Creators prepare their profiles for brand audits by standardising their 12-post publishing cadence, pruning inactive ghost followers, optimising hooks for saves and shares, and reinforcing baseline engagement metrics at least 30 days before pitching PR agencies.
Because agencies evaluate profiles using rigid quantitative filters before a human ever reads a cold pitch email, creators who neglect profile hygiene often get filtered out automatically. Whether preparing for outbound brand outreach or responding to inbound agency enquiries, proactive talent managers run a 30-day pre-pitch optimisation sprint across the creator’s grid.
First, creators audit their most recent 12 posts through the exact lens a brand buyer uses. Underperforming filler posts, off-niche experiments, or dated giveaways that tank median engagement are archived so the visible feed presents a cohesive topical identity. Second, creators restructure their video hooks and carousel slides to explicitly drive saves, shares, and detailed comments—for instance, ending a fitness reel with a downloadable checklist prompt or asking followers to vote between two specific training splits rather than using a generic “Link in bio” sign-off. Combined with strategic profile reinforcement such as passing brand engagement audits with SoldOutX, creators ensure their recent posts display stable like-to-view ratios, active comment discussions, and healthy save velocity when an agency analyst opens their profile.
MINI CASE STUDY BOX — BEFORE VS. AFTER VETTING IMPACT (5.2x ROAS)
A UK D2C supplement brand vetted two 20k-follower fitness creators: Creator A had 22k followers but erratic views and 1–2 generic emoji comments per post. Creator B had 14k followers, consistent 300+ likes, and 25+ detailed comments/saves per post (reinforced via SoldOutX engagement packages). The brand hired Creator B for £350 and generated £1,850 in tracked promo-code sales (5.2x ROAS).
Finally, audit-ready creators assemble a transparent, verification-first media kit. Instead of quoting inflated lifetime reach numbers, top-converting creators attach unedited, date-stamped screenshots of their last 30 days of Instagram and TikTok Insights—highlighting their UK/US audience percentage, 25–34 age concentration, median 12-post views, and past campaign conversion case studies. Presenting verified first-party data upfront removes agency friction, shortens contract negotiation cycles, and justifies premium flat-fee rates.
Frequently Asked Questions
These frequently asked questions provide direct, self-contained answers on creator vetting benchmarks, 12-post audit standards, target CPM ranges, first-party analytics verification, and pre-pitch profile optimisation for UK and US influencer marketing campaigns.
1. What do brands look for first when vetting an influencer?
Brands first check audience demographic alignment and engagement consistency across recent non-pinned posts. Before reviewing creative aesthetics, marketers verify that over 60% of followers reside in target buyer regions and that views, likes, saves, and substantive comments remain stable.
2. How many recent posts do brands check during an account audit?
Agencies standardly audit the last 12 non-pinned feed posts or short-form videos. Inspecting a 12-post window provides roughly four to six weeks of publishing data, allowing analysts to calculate reliable median views and spot engagement drops on sponsored posts.
3. What is a good Cost Per Thousand Views (CPM) for influencer campaigns?
In the UK and US markets, a competitive influencer CPM ranges between £15 and £35 ($20 to $45) for general lifestyle creators, and £35 to £60 ($45 to $75) for high-intent B2B, finance, or credentialed health specialists calculated against median 12-post views.
4. Why do brands ask for screenshots of Instagram and TikTok Insights?
Brands request first-party Instagram and TikTok Insights screenshots because third-party databases only estimate metrics from public data. Native analytics screenshots confirm exact 30-day reach, non-follower view percentages, save and share counts, and verified country and age breakdowns.
5. How can creators fix inconsistent engagement before pitching brands?
Creators can stabilise inconsistent engagement over a 30-day sprint by archiving off-niche posts, publishing three to four times weekly at peak audience hours, using save-driven educational formats, replying immediately to early comments, and reinforcing flagship post metrics before sending media kits.
Final Verdict
Successful influencer marketing in 2026 depends on disciplined, data-backed creator vetting rather than chasing raw follower counts, combining database discovery filters with manual 12-post engagement, comment quality, and first-party demographic audits to protect campaign ROI.
For UK and US brand marketers, applying the 6-point vetting scorecard transforms creator partnerships from unpredictable gambles into repeatable revenue channels. By weighting last-12-post median consistency (25%), authentic comment threads (20%), verified UK/US demographic splits (20%), and save/share velocity (15%) alongside production quality (10%) and brand safety (10%), teams eliminate wasted budget on hollow reach. For creators, understanding this exact evaluation framework is the fastest way to command higher rates: audit your recent grid, nurture active comment discussions, document your first-party Insights, and approach every brand pitch with the exact conversion evidence performance marketers demand.

Discussion